
The title we have chosen for this in-depth analysis is certainly not an imperative, but a noun linked to a technical and legal term that characterizes most illiquid funds: the suspension of redemptions, which—in technical jargon—is called a “gate” (or “cancello” in Italian): essentially, it involves closing the gates (blocking redemptions) when there is a mass exodus from the investment. This is a problem when assets are illiquid because selling them quickly results in a massive deterioration in the realizable price. This phenomenon has recently characterized the world of private credit (and beyond).
Private credit is distinct from market credit (or public credit, to stick with the English terminology). Both are forms of credit, but the public sector typically consists of tradable bonds that pay fixed or variable rates, while private credit is not traded (or very rarely so), generally pays a variable rate—say, 5 percentage points above benchmark rates (which we’ll discuss later)—and is labeled to indicate its seniority within the borrower’s capital structure: in other words, its priority for repayment if the borrower defaults.
It may also have customized terms to protect creditors and include specific segregated assets intended to secure the loan. Confusingly, however, “private credit” can mean different things. In the context of insurance companies, private credit mostly (but not exclusively) refers to “investment-grade” loans (and also privately placed bonds). These can be loans to businesses, mortgage- or asset-backed securities, or rated tranches of securitizations such as CLOs.
Let’s therefore establish some clear points and state that when we talk about private credit, we usually mean direct loans to highly indebted companies, granted by funds managed by private market operators such as Apollo or Blackstone, or loans to private equity funds to acquire mid-sized companies.
The private credit market has grown into a trillion-dollar industry, especially after the 2008 financial crisis, when banks stopped making these loans. Understanding the size of the broader private credit market—which includes insurance, investment-grade loans for data centers, etc.—is difficult. And this is already a problem in itself.
One would need to understand not only how much has been lent and to whom, but also who made each loan. Bank credit, for example, is not usually considered private credit, even though technically it is. But the exact same loan made by an insurance company, a structured finance vehicle, a BDC (Business Development Company), or a private credit fund is.
Adding up the assets in private credit funds managed by private market operators and BDCs, the total is estimated at $2.3 trillion. And this figure is expected to double over the next four years (see Figure 1).
This is in line with estimates from the Fed, the BIS, and other observers concerned about its dynamics. Still small compared to public credit, but growing rapidly.
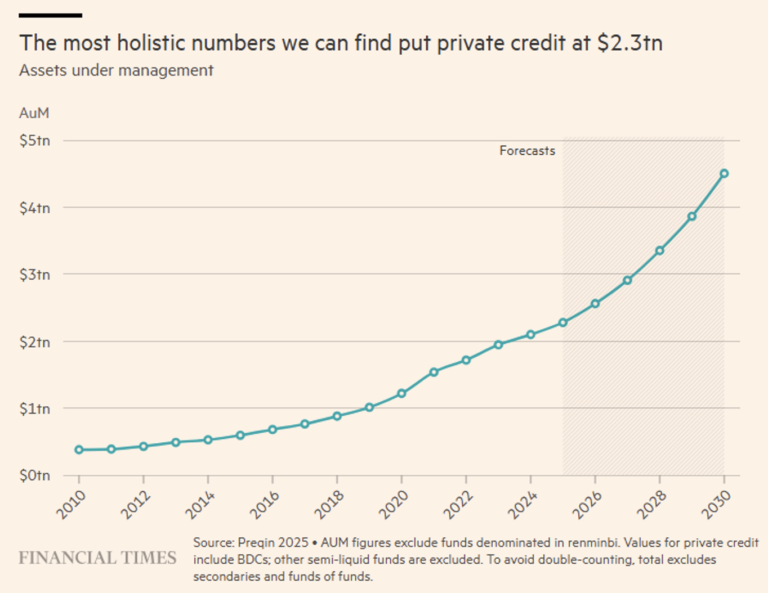
Figure 1. Growth (including projected growth) of the private credit market.
There has been a great deal of discussion about private credit lately because it has raised a wide range of concerns:
i. alleged high-profile fraud cases;
ii. an unusual concentration on loans to companies at risk of disruption caused by artificial intelligence;
iii. suspension of repayments;
iv. the emergence of numerous billion-dollar fund managers;
v. market opacity.
But beyond these issues, the private credit market has certain structural vulnerabilities that we’ve discussed in our previous Insights. Today we’ll focus on one in particular: infrequent valuations (“stale pricing”) and a lack of transparency, which lead to harmful consequences such as:
1. NAV misalignment because reported values do not promptly reflect asset deterioration.
2. Incentive for opportunistic redemptions, as short-term investors redeem before NAVs are updated (first-mover advantage). Although the rush for redemptions is a typical panic scenario characteristic of retail investors, we are not referring to them here, but to sophisticated investors capable of taking advantage of the delayed NAV update.
3. A destabilizing effect, as redemptions first force a suspension of redemptions and then trigger rapid sales, which, in turn, generate downward pressure on prices and further erode confidence. This is the classic vicious cycle that overwhelms retail investors and forces funds to suspend redemptions to protect investors who do not rush en masse toward liquidity.
To improve the system’s resilience and reduce the need for “red lines,” one proposal on the table could be to increase the frequency of NAV calculations (monthly, but also daily) and to enhance transparency, particularly regarding portfolio composition, in order to highlight concentration risk—another critical issue in private debt. This issue is common to all illiquid investments, as demonstrated by the recent case of a real estate fund managed by UBS, which, following a sudden and unexpected (?) surge in redemptions, suspended redemptions for up to 36 months.
That the quality, frequency, and credibility of ratings are crucial issues for illiquid investments is demonstrated by the SEC’s recent stance toward the rating agency Egan-Jones, whose ratings regarding private credit in the U.S. have been called into question due to inadequate resources (a staff of twenty people) and processes.
But there is also the other side of the coin, a side that inevitably draws parallels with the 2008 financial crisis linked to subprime mortgages. Investors specializing in distressed debt view the current phase of the private credit market as an extraordinary opportunity, comparable—in terms of return potential—to the one that emerged after the 2008 financial crisis.
In recent years, these players had remained on the sidelines, as growing markets and abundant liquidity had reduced the number of distressed situations. Today, however, the landscape has changed: private credit has grown enormously and is now showing signs of strain. Several semi-liquid funds are facing redemption requests totaling billions of dollars, primarily due to doubts about the quality of their investments, particularly their exposure to software companies potentially vulnerable to the impact of artificial intelligence (see Figure 2). (Low) quality not adequately reflected in (overvalued) valuations.
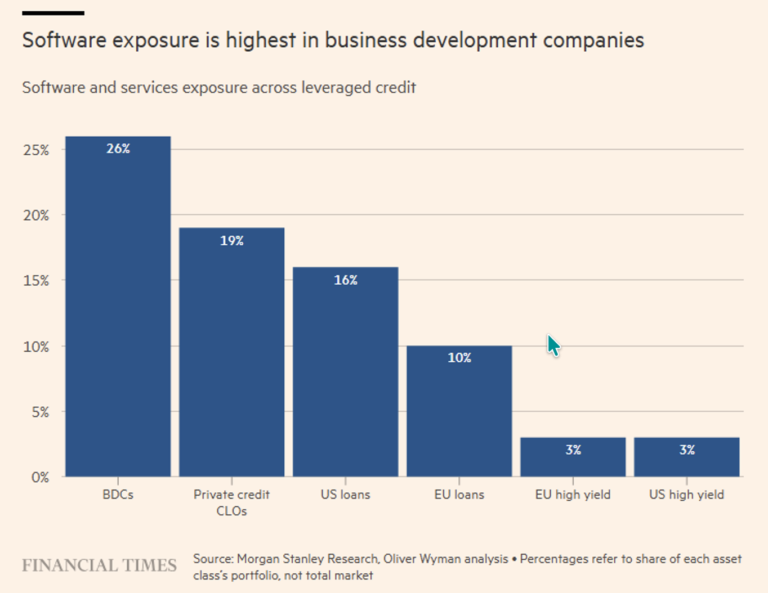
Figure 2. Exposure of various players in the software sector.
This pressure is creating dynamics typical of periods of stress: forced sales, an increase in financial distress, and a deterioration in credit quality. Indicators such as the interest coverage ratio (ICR—see below) signal a significant deterioration, while many companies are deferring payments and accumulating further debt. According to some market participants, this implies that the actual default rate is underestimated.
In this scenario, distressed funds are preparing to capitalize on the situation by purchasing undervalued assets from companies in distress but still economically viable. Some are already raising new capital or increasing liquidity in their portfolios to be ready to act when opportunities become more apparent. The widespread belief is that the number of distressed situations may exceed the capital available to manage them, thereby creating very favorable conditions for those with resources.
Not everyone, however, shares this view. Some private capital operators believe that distressed investors are exaggerating the current risk to generate interest and fundraising opportunities, noting that similar predictions—for example, following the collapse of Silicon Valley Bank in 2023—did not ultimately materialize into a widespread crisis.
In short, we are witnessing a clash of perspectives: on one side, those who see the deterioration of private credit as the beginning of a cycle rich in opportunities; on the other, those who consider these fears exaggerated or premature. However, the former are playing dirty, in our view, because they aim to spread that minimal concern (even if unfounded) and instill enough well-founded doubts to push the banking system to withdraw credit lines, fully aware that this move would be enough to trigger a systemic crisis.
To fully understand the risks and opportunities of this investment, we suggest taking a few minutes to revisit the basics and explain, in simple yet effective terms, what credit risk is. Let’s use an example: if the British government issues government bonds in pounds, it incurs a debt that is not subject to credit risk because it can always print money to repay it. But if it were to issue the same bonds denominated in euros, then we would be dealing with credit risk because, in the event of default, the UK—unable to print euros—would have to restructure the debt or declare bankruptcy. In reality, this latter possibility (latter in the sense of definitive) also arises when a state issues its own currency, as demonstrated by the Russian debt crisis in 1998 or the situation in Argentina at various points in time (let’s say that the land of the tango is a veteran of sovereign defaults: 1982, 1989, 2001, 2014, 2020—without going too far back in time).
In general, we can say that credit risk exists when the debtor may fail to honor its debt obligations (not only for the repayment of principal but also for the timely payment of interest—which is why we also speak of “counterparty risk”), and thus, in practice, credit risk arises every time a debt is incurred. But the academic world of economics teaches us that there is the famous risk-free rate, which in fact turns out to be one of the many “heroic” assumptions made by economists because the risk-free rate is like any Marvel hero: it simply does not exist.
The chart below (Figure 3) captures the majority of bonds issued in the currencies of developed countries. It is estimated that approximately $45.5 trillion of the total $72.7 trillion is subject to credit risk.
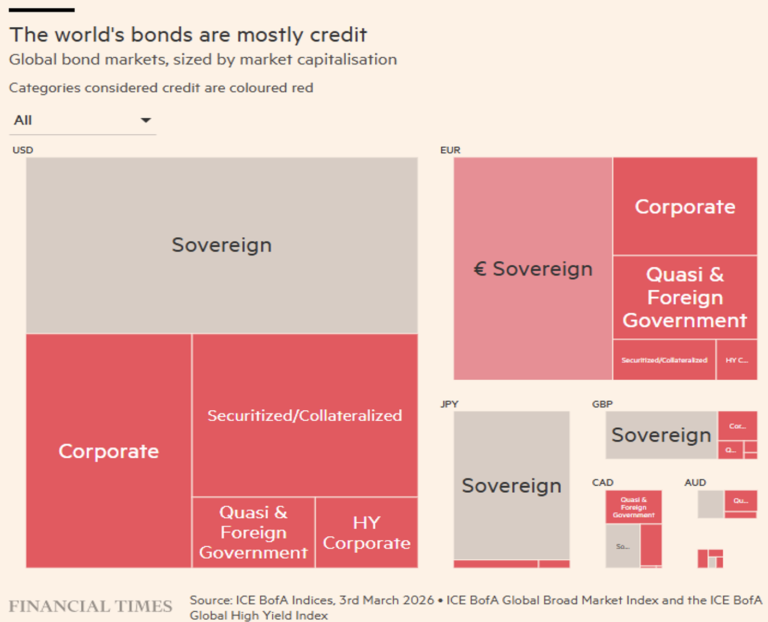
Figure 3. Global overview of the credit market broken down by currency/country.
All the rest (approximately $27.2 trillion in debt “free” of counterparty risk) can be used as a reference for the risk-free rate, which is essential for pricing credit risk. A benchmark rate that is “presumably” risk-free, such as the U.S. Treasury bond rate (perhaps until a few years ago, but now?) or the SOFR (the Secured Overnight Financing Rate, i.e., the weighted average rate of Treasury-backed repo transactions—secure because it is backed by Treasury Bills, and so we’re back to square one) or even overnight interbank lending rates, such as LIBOR, for example. The difference from this base rate (spread) becomes a good measure of credit risk, at least according to some.
We also propose an alternative (and complementary) interpretation of the spread using another metric to assess credit risk: the debtors’ credit rating or creditworthiness. Provided by the much-maligned rating agencies, we’ll break down some figures that may, in part, rehabilitate them.
Understanding which borrowers are so unstable that they end up in bankruptcy seems simple. But it isn’t. Because, although almost all large companies manage to survive, say, a five-year time horizon, a minority does not. And it is precisely in distinguishing between “almost all” and “all” that the value lies.
The major credit rating agencies alone employed 5,392 analysts at the end of 2023 (see Figure 4). Their job is to estimate the probability of default as accurately as possible. If you add in credit officers and analysts from banks, mutual funds, hedge funds, private equity funds, financial specialists, and so on, you likely arrive at hundreds of thousands, if not millions, of people engaged in credit analysis.
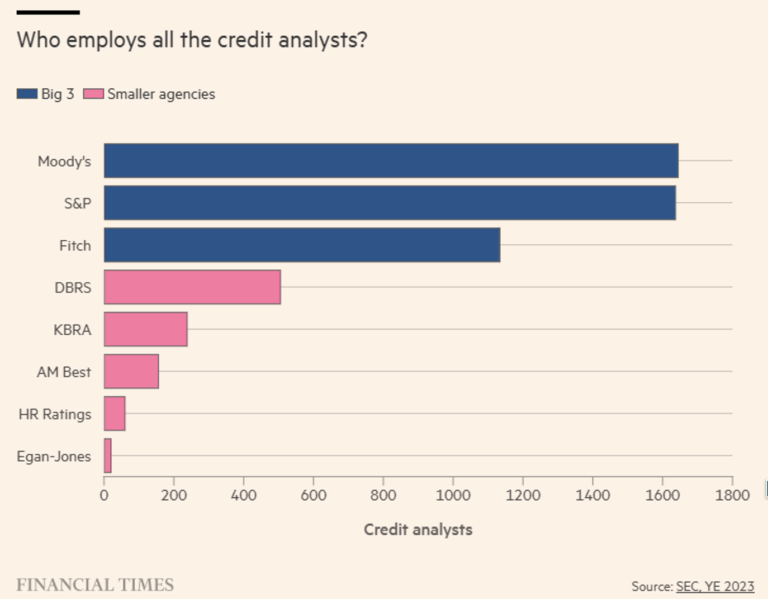
Figure 4. Where do credit analysts work?
The analysts’ task is to make accurate assessments. Stating that there is a 99% probability that a borrower will be able to meet principal and interest payments over the next five years might seem like a judgment that considers them a truly solid credit risk. But a borrower who appears 99% likely to meet their obligations would barely qualify for the lowest levels of “investment grade” (IG)—to use the jargon of the credit industry.
And what if a borrower were considered creditworthy with only a 97% probability? That would make them “non-investment grade” (according to Moody’s), “speculative grade” (according to S&P and Fitch), “junk” (according to credit experts and bond traders), or “high yield” (according to financial marketers and traders). All synonyms, of course!
Table 1 shows the different rating levels of the three major agencies. The ratings are not strictly equivalent, but we don’t want to get too bogged down in technicalities. We have highlighted the ratings below IG—that is, those with the highest credit risk.
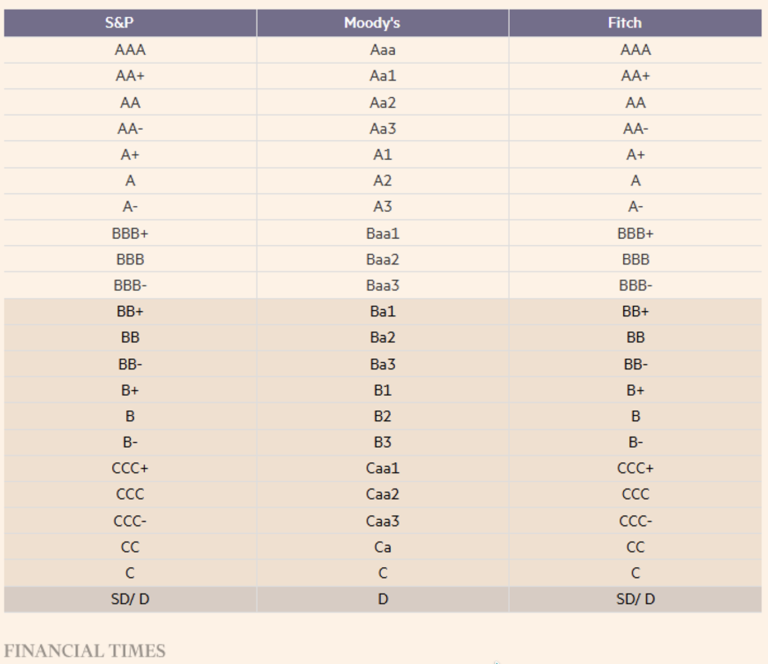
Table 1. Creditworthiness indicators used by the three major rating agencies: S&P, Moody’s, and Fitch.
Managers (bond managers, but not only them) have every interest in portraying rating agencies as slow, somewhat obtuse, or financially subservient to their funders. Judging by their performance during the 2008 crisis, how can one blame them?
But credit is binary: pay or don’t pay, default or don’t default; that is the dilemma. So, depending on the outcome, every rating will tend to seem, in hindsight, either too lenient or too harsh.
However, if we look at the incidence of cumulative defaults relative to the corporate ratings provided by S&P over the past few decades (see Figure 5), we get a striking yet comforting picture, because it offers us glaringly obvious evidence that—at least in systemic terms—ratings seem to serve a real purpose.
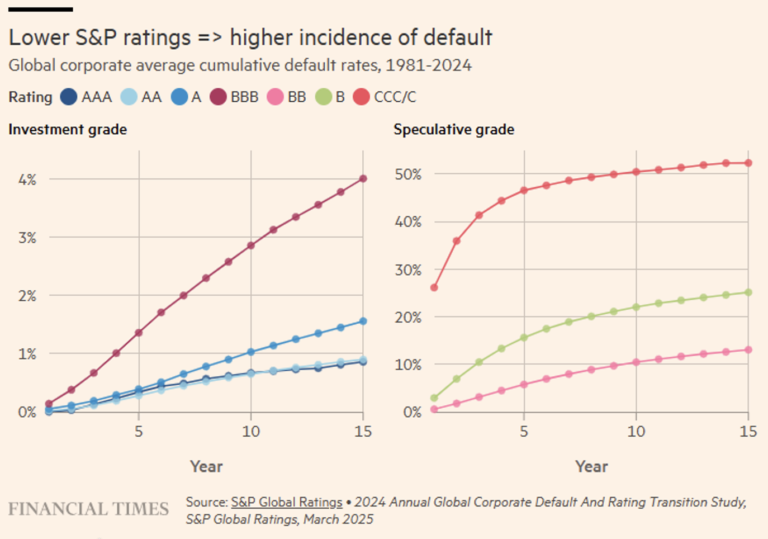
Figure 5. Default rates by S&P rating.
As one moves down the rating spectrum, from triple-A to triple-C—the lowest rating a company can have while still being able to pay its debts—the incidence of defaults increases—even over a five-year horizon—by a factor of 10.
And while any single rating may be open to question, at the aggregate level the agencies do an excellent job of determining whether a company has a 0.7 percent probability of defaulting over a 10-year horizon (which would make it “AA”) or a 1.0 percent probability of defaulting in the next decade (making it a modest “A”).
Of course, if one were unlucky enough to have concentrated one’s loans in that 1 percent of “A” credits that went bad, the favorable fate of the remaining 99 percent would be of little comfort. The set of companies and institutions facing “A”-grade credit risk, for example, can be thought of as a box where 1 percent of the balls are red—representing the entities that will fail, regardless of macroeconomic and general market conditions.
While defaults, bankruptcies, distressed debt exchanges, or restructurings sometimes coincide with economic recessions, this is not always the case, as Figure 6 demonstrates.
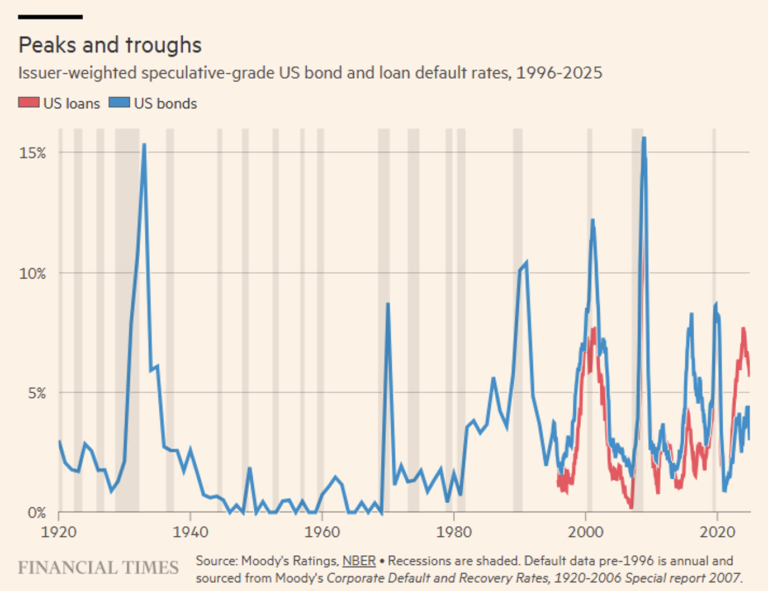
Figure 6. Default rates on U.S. bonds and mortgages from 1920 to the present, with periods of recession highlighted (light gray bars).
Default rates within individual sectors or industries can be even more concentrated. In the early days of the European high-yield market, issuers were dominated by telecommunications and cable companies. In 2002, the default rate in the European cable sector exceeded 80% of the amount borrowed, and half of European telecommunications debt also defaulted. Overall, this caused over 40% of the total European market to default in terms of value.
One last thing about defaults. It’s easy to think that companies default because they go bankrupt. Of course, companies that go bankrupt tend to default. But increasingly, defaults occur without a company “hitting the wall.” Most of the non-financial corporate debt with an S&P rating that has defaulted over the past five years did so through a distressed debt exchange—which can be any debt restructuring transaction (renegotiation of contractual terms) intended to leave the debtor in a worse position than simply paying interest and principal (e.g., additional collateral requirements).
But how do you analyze a company’s creditworthiness? Obviously, we’ll avoid answering this question because we’re not writing a technical book on the subject, but we can highlight a couple of important points on the matter. First, the metrics: the ratios of interest and debt to EBITDA, namely:
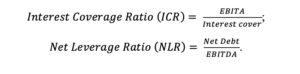
Earnings Before Interest, Taxes, Depreciation, and Amortization (EBITDA) has—like all indicators—its limitations, but when it comes to understanding what resources a company may have available to pay interest, EBITDA is not the worst measure and does its “dirty” work: earnings before interest, taxes, depreciation, and amortization are what can be used to pay the interest due: but note that they must be actual earnings (and preferably generated by a consistent cash flow).
Figure 7 shows how median credit ratios appear when using EBITDA (or EBITA) across the universe of non-financial, non-utility corporate borrowers rated by Moody’s.
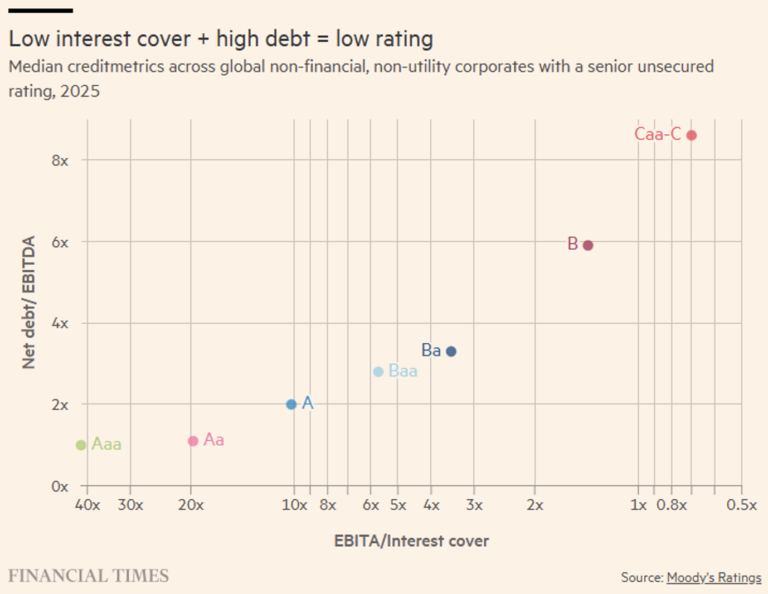
Figure 7. Moody’s ratings relative to the two main measures of creditworthiness.
Although by no means exhaustive, the chart in Figure 7 offers at least a rough idea of what the outcome of a rating process might be for a company with a debt-to-EBITDA ratio of 5x and an interest coverage ratio of 2.5x. Furthermore, from our graph in Figure 5, we can infer that such a company has about a 90% probability of being able to service its debt over the next five years, because in the graph on the right it falls halfway between the green line (BB) and the pink line (B).
In Figure 8, we show the spreads of several well-known U.S. companies relative to Treasury (UST) rates. Specifically, for the main rating categories, we have selected the company with the largest market capitalization. Assuming these companies will succeed, one might consider these spreads as free money. Or perhaps not? Is it really worth it?
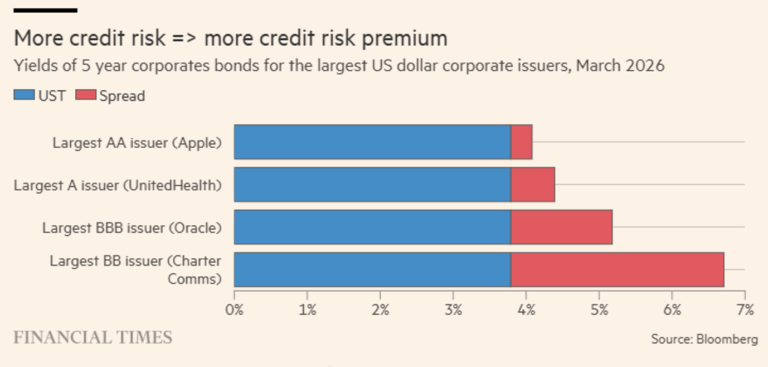
Figure 8. Some examples of spreads.
During those long periods when virtually all borrowers are able to service their debts or find some unsuspecting party to refinance their debts so they can remain in good standing, the manager of a credit portfolio that pushes the limits (i.e., takes on significant credit risk by focusing on speculative-grade debt) will tend to achieve the best results—attracting new client flows and pocketing hefty bonuses.
This is an ideal scenario, but adequately diversified credit risk tends to more than offset the risk of default or rating downgrade. Rating changes are important because if a manager is required by mandate or charter to hold only IG corporate bonds, and the BBB-rated borrower to whom they have extended a loan is downgraded by the agencies, there will necessarily be a forced sale resulting in any loss in value at market price (even a significant one), regardless of whether the borrower avoids default or not.
Essentially, the credit spread compensates for expected credit losses weighted by probability, however uncertain they may be. Thus, the spread is a reward for the credit risk an investor assumes. We believe this is only partially true because there is another risk we have not discussed so far but which emerges—almost unexpectedly—yet with all its negative force during periods of stress, if not crisis: liquidity risk. The prices of certain large exchange-traded funds that invest in credit (see Figure 7) should speak for us and support our argument.
As anyone who has had the misfortune of trying to trade a large chunk of corporate debt (or other assets) can attest, the ability to sell or buy—even in seemingly liquid public markets—can seem rather sporadic. When markets are under pressure, the ability to adjust allocations is minimal or nonexistent.
Unfortunately, the kind of trading data we would need to fully demonstrate this point is proprietary and not publicly available. But we can still illustrate the concept by observing how the prices of corporate bond ETFs deviate from their net asset value (NAV) at various times (Figure 9). And it is a well-known fact that the liquidity of ETFs (at least passive ones) depends entirely on the liquidity of the underlying assets whose prices they track at the time of trading.
An ETF (or ETC) on energy commodities (oil, natural gas, heating oil, or unleaded gasoline) has the same liquidity as its underlying assets: during an energy crisis (such as the one we are currently experiencing), these commodities are clearly impacted in terms of liquidity, and consequently so are their passive replicas. The same obviously applies to credit, whether considered as an underlying asset or incorporated within the underlying.
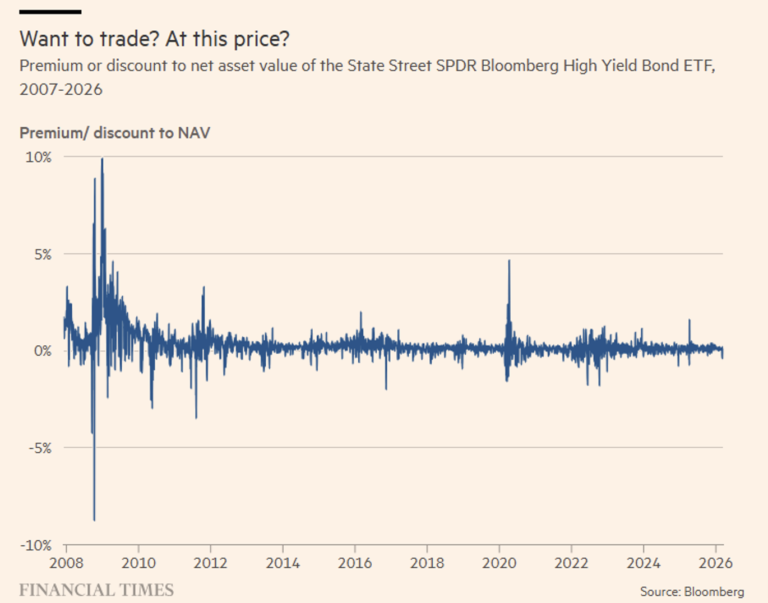
Figure 9. Spread relative to NAV of the SPDR Bloomberg High Yield Bond ETF since the Great Financial Crisis of 2008.
The premiums and discounts relative to NAV recorded during the most critical period of the global financial crisis in 2008 were staggering and served as a useful indicator of trading conditions for corporate bonds (left side of the chart in Figure 9).
For example, attempting to sell a U.S. junk bond ETF on October 10, 2008, would have yielded only 91 cents for every dollar of NAV—and the spreads on the bonds comprising the NAV were already extremely wide, at 1,500 basis points relative to Treasuries. Trying to buy junk bonds through the same ETF at the end of December—when spreads had widened further to 1,768 basis points—would have meant paying $1.10 for every dollar of NAV.
The key point is precisely the price-to-NAV gap. And when we plot a chart for the four largest corporate bond ETFs (two investment-grade, two junk), what stands out is that trading costs and credit spreads appear to be loosely correlated (see Figure 10).
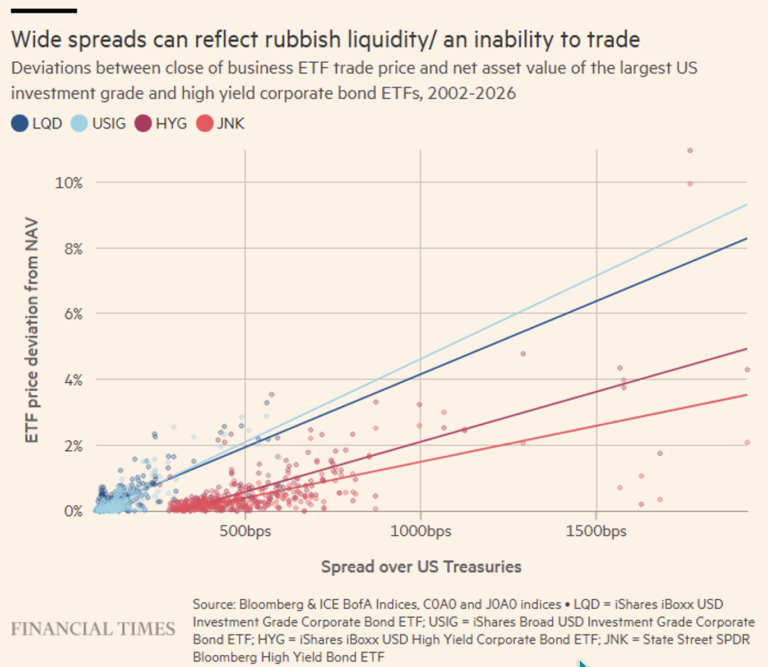
Figure 10. Correlation between an ETF’s NAV spread and its underlying asset priced as a spread over the Treasury.
This is because spreads reflect the cost of imperfect liquidity, as well as uncertainties regarding borrowers’ ability to repay their debts, and the imperfect liquidity premium increases significantly as trading conditions deteriorate.
It goes without saying that private credit is a prime example of credit risk and liquidity risk, which is why recent financial news events have turned a “permanent” spotlight on this important market segment.
Disclaimer
This post reflects the personal opinions of the Custodia Wealth Management staff who authored it. It does not constitute investment advice or recommendations, nor does it constitute personalized consulting, and should not be considered an invitation to engage in transactions involving financial instruments.