
As usual, the end of the year is always a good opportunity to take stock and help set the course for the coming months. We too are doing our bit by identifying what we believe to be the most important issues (both positive and negative) from an economic and financial perspective. Three events stand out as particularly noteworthy:
1) The tariff war and its repercussions on the global economy and the role of the dollar
2) The explosion in precious metals
3) The performance of technology stocks at the expense of other sectors, with the exception of finance
The trade war
Donald Trump’s return to the White House in 2025 brought a turbulent year for world trade, frightening bond markets and forcing global supply chains to reorganize.
Nevertheless, the global trading system proved resilient, with the huge imbalances caused by China’s manufacturing boom still evident.
“Liberation Day” undoubtedly shook the markets, but the US president immediately backtracked, ultimately striking deals with China to save face and concluding so-called “napkin” agreements with the EU and countries such as Japan and South Korea.
Nevertheless, the US ended the year with an effective tariff rate of over 10%, the highest since World War II (see Figure 1).
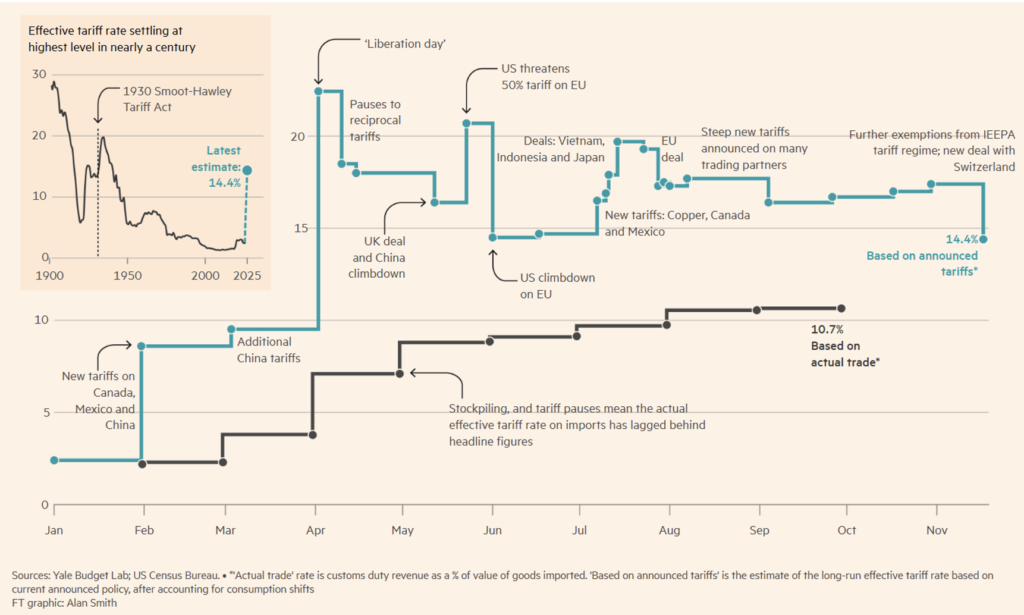
Figure 1. Evolution of the tariff war during 2025.
Americans are suffering the consequences because, since August, they have been feeling a clear impact on consumer prices.
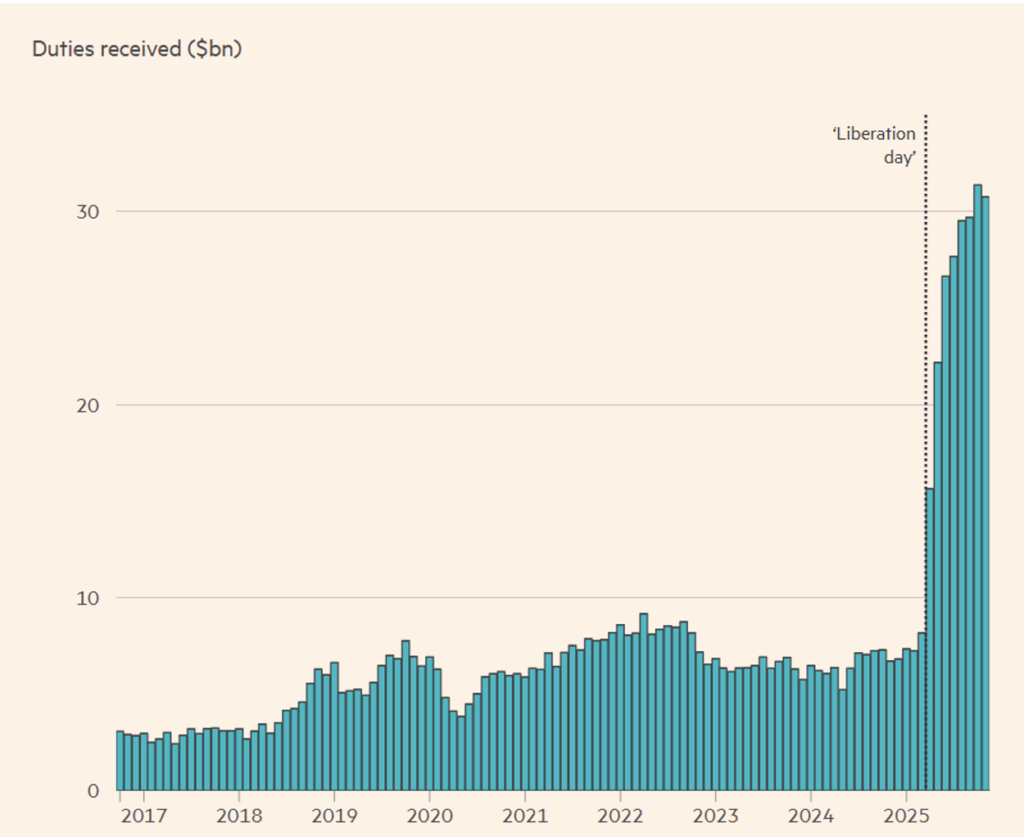
Figure 2. US tax revenues limited to tariffs.
Since the trade war began earlier this year, monthly revenues from customs duties have risen to over $30 billion, but still represent only a small fraction of total federal revenues, as shown in Figures 2 and 3.
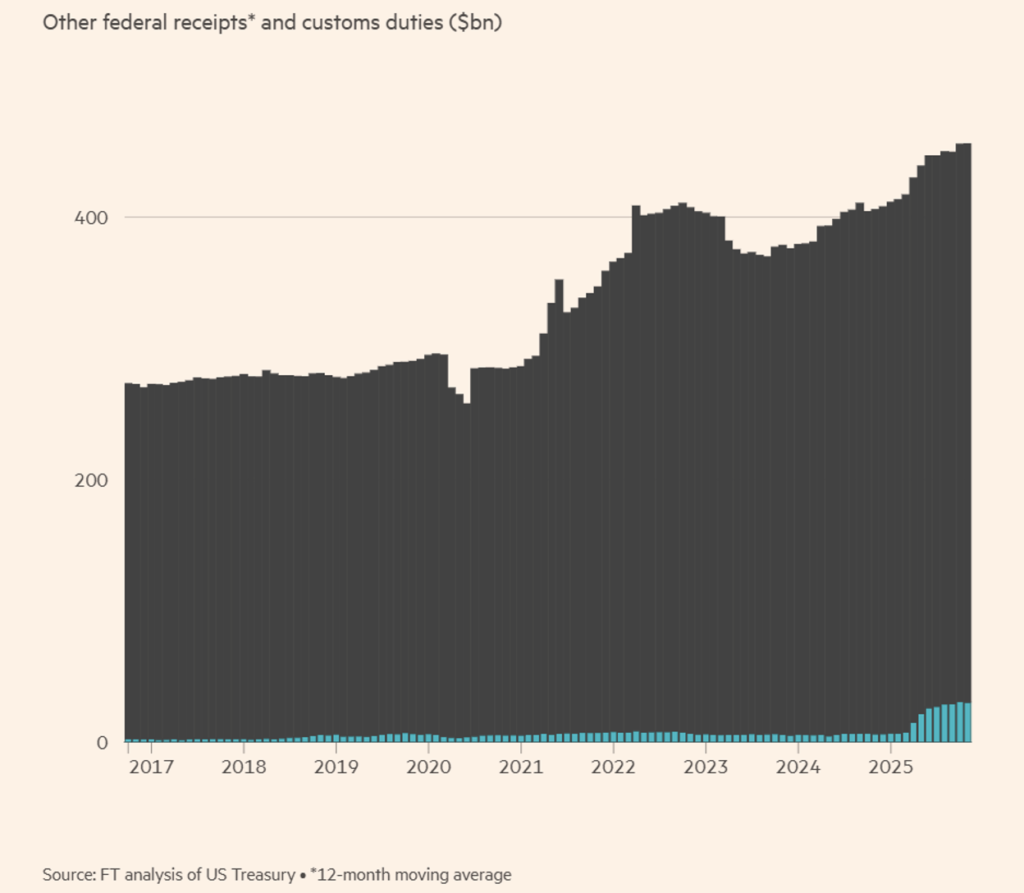
Figure 3. Trend in tariff revenues for the US treasury compared to total federal tax revenues.
However, globally, the trade war has not yielded the expected results, as many economists and analysts had immediately predicted.
In November, China’s trade surplus exceeded $1 trillion despite an effective 40% tariff on Chinese imports, and US imports from Southeast Asian countries continued to grow in 2025, even though many of them were still subject to 20% tariffs (see Figure 4).
The huge gap between Chinese imports and exports widened further, despite Chinese exports to the US falling by 40% year-on-year in the third quarter of 2025.
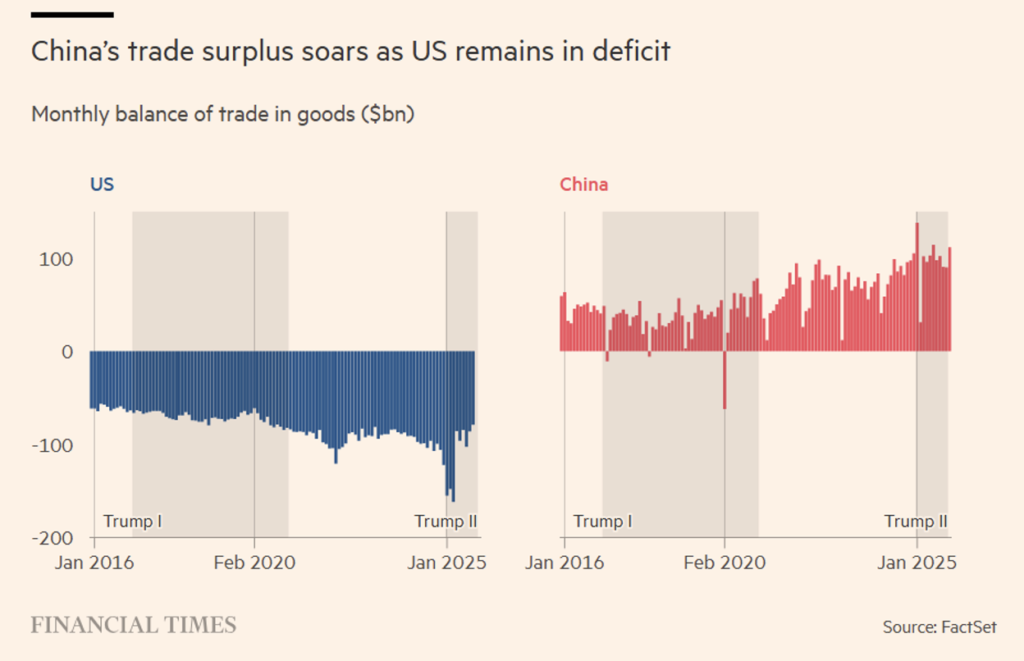
Figure 4. US and Chinese trade balances compared.
The numbers reflect the simple reality that Europe and the US cannot compete on cost with China and Southeast Asia when it comes to manufacturing. As we have already highlighted in previous Insights, the figures are reversed when we talk about services, particularly financial services, which are obviously not affected by tariffs.
Beijing’s huge surpluses in industrial products, including chemicals, automobiles, steel, solar panels, and machinery, have seen exports to Asia, Europe, and the Gulf grow.
The US has not been alone in challenging China’s excesses. The EU has announced plans to double tariffs on steel.
International trade experts said that the combination of Chinese goods being diverted through other Southeast Asian countries to avoid US tariffs, along with price discounts and a boom in technology component exports, ensured that the yellow giant would continue to grow in 2025.
Southeast Asia also defied expectations by continuing to thrive. Vietnam, a country targeted by US trade policy and originally threatened with a 46% tariff, saw its trade surplus with the US reach a record high of $121.6 billion in the first 11 months of 2025 (see Figure 5).
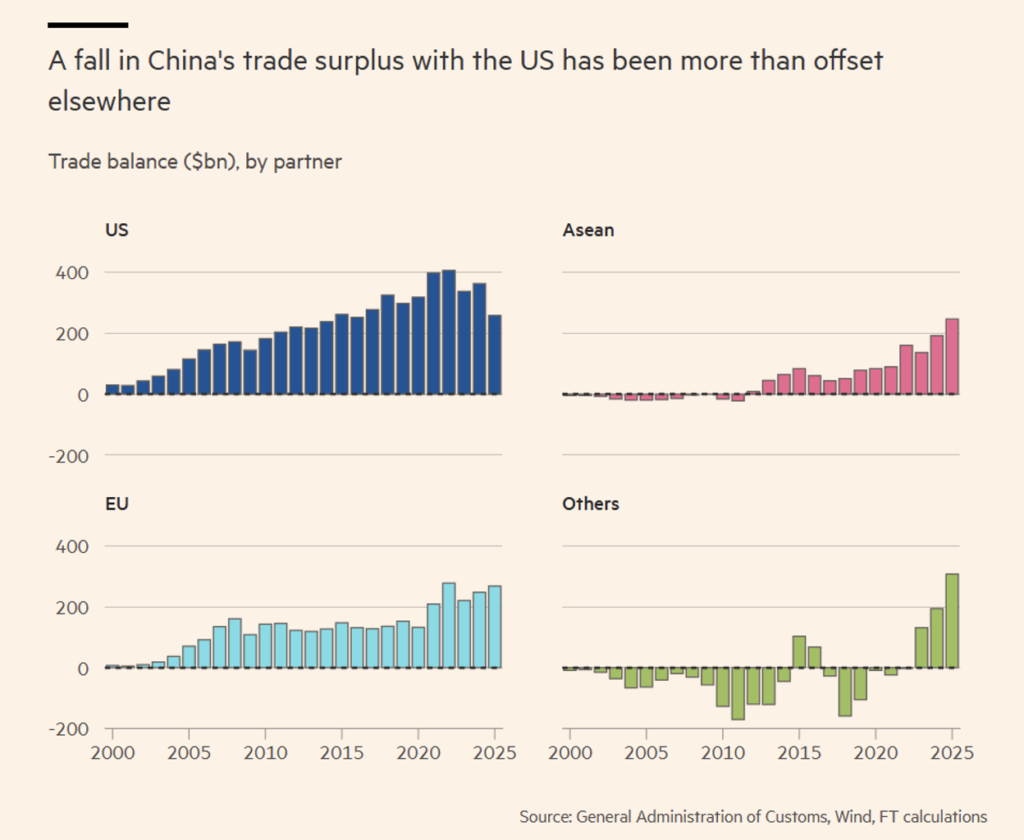
Figure 5. Where Chinese exports have been diverted to circumvent US tariffs.
The effects have been evident in Chinese exports of electric vehicles to the EU, which have increased in volume but not in value over the past year, demonstrating that Chinese manufacturers have applied price discounts to maintain sales.
The US administration has never hidden its plans to reduce the US trade deficit by imposing tariffs on the country’s main trading partners.
But financial markets had not anticipated how far it would go to achieve this strategic goal. The President’s announcement on April 2 of tariffs of up to 50% on a number of countries, including a remote Antarctic outpost inhabited only by penguins, caused global stock markets to lose more than $2 trillion in value in a single day.
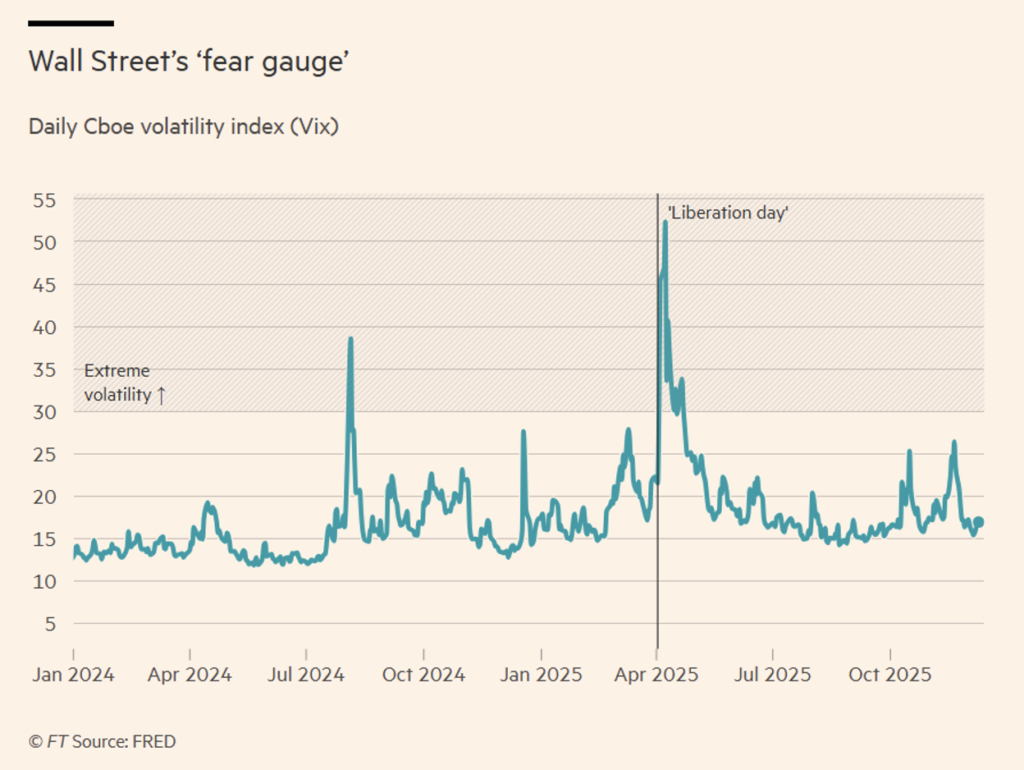
Figure 5. Implied volatility (VIX) over the last two years.
Apart from the penguins, economists ridiculed the methodology used to generate the tariff data, which took the actual US trade deficit with each country as an indicator of alleged unfair practices and then divided it by the amount of goods imported into the US from that country.
The turmoil did not last long, however. Within a week, the uncertainty measured by the VIX volatility index (see Figure 5) quickly subsided when the US president backtracked, announcing a 90-day (cooling-off) pause after accusing people of being “excited.” The S&P 500 index jumped about 9% on the news, adding more than $4 trillion to the index’s value.
These embarrassing U-turns led the FT to coin the idea of a “Taco trade,” an acronym for Trump Always Chickens Out. The idea caught on, and markets became convinced that the US administration would always back down in the face of the threat of real trade turmoil.
However, over the course of the year, Trump found ways to impose the highest tariffs on US imports since World War II. The effective U.S. tariff rate, which measures the revenue from tariffs on goods as a proportion of their import value, generally followed a downward trajectory between World War II and the global financial crisis. In 2008, the rate was 1.3%. Today, according to the Yale Budget Lab (see Figure 1), the US tariff rate based on stated policies and taking into account changes in consumption is just over 14%, a level last reached in 1939, in the pre-war era, when US foreign trade policy was dictated by the protectionist law known as the Smoot-Hawley Tariff Act.
The question remains as to exactly how much the tariffs have cost America. Calculations by Democrats on the US Congress Joint Economic Committee found that tariffs have cost the average American family nearly $1,200 (per family) since Trump returned to the White House this year (see Figure 6).
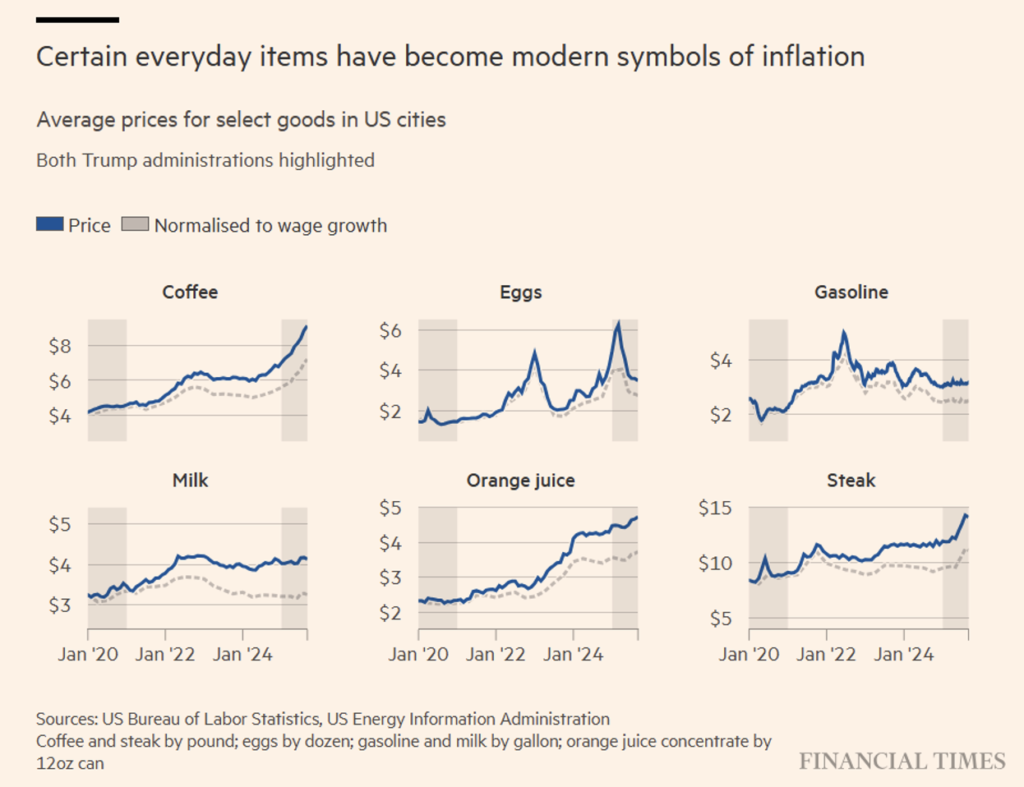
Figure 6. The increase in the cost of basic necessities for an average family.
The US president has said he wants to use the proceeds from tariffs to pay a dividend to American taxpayers. So far, however, the numbers don’t add up. The Financial Times’ analysis of tariff revenues shows that paying $2,000 to US adults with incomes below $150,000 would cost about $500 billion, much more than the revenues generated by the tariff increases.
Despite the promise that tariffs would enrich Americans, in November the US administration was forced to reduce taxes on a range of agricultural imports due to growing discontent over food prices, followed by exemptions from “reciprocal tariffs” on key products such as coffee, cocoa, beef, and bananas.
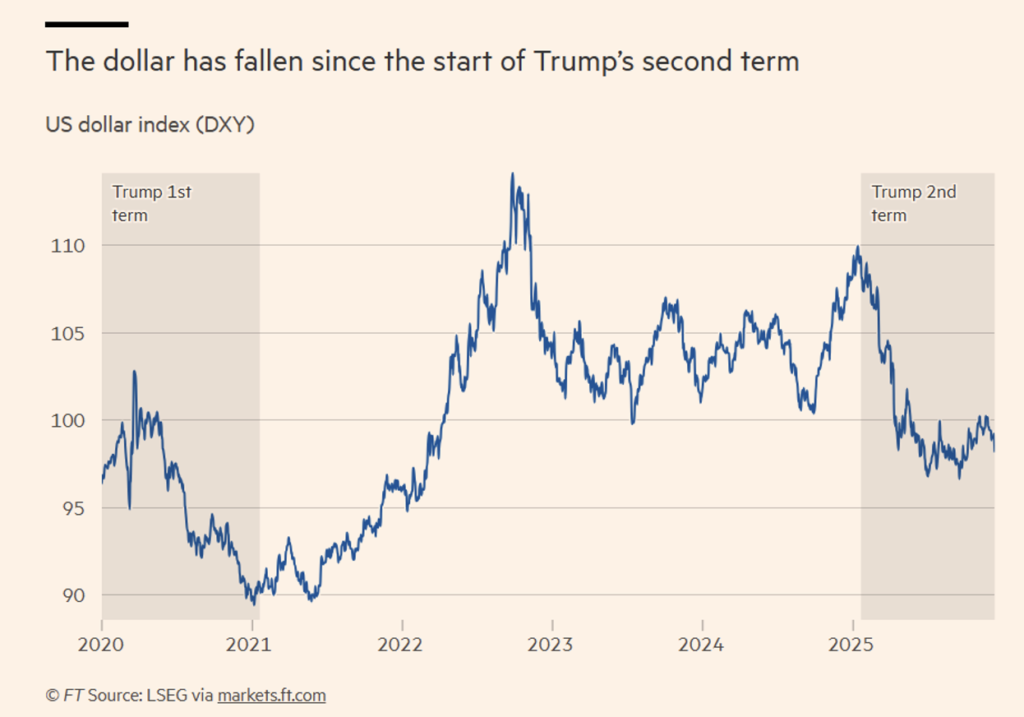
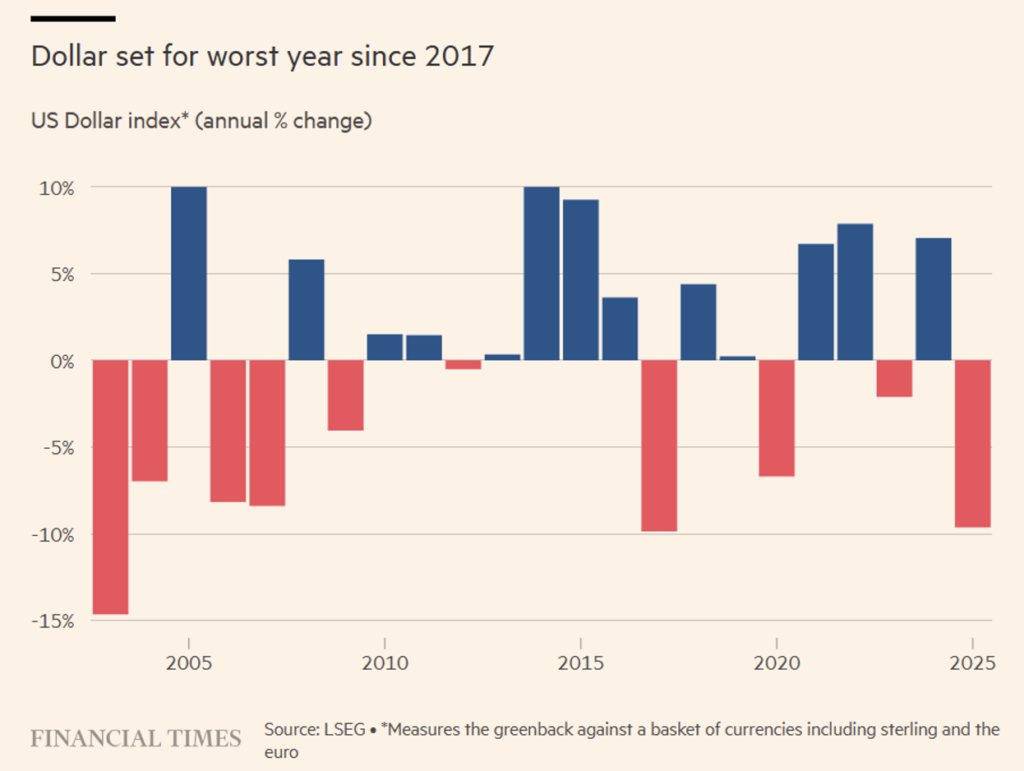
Figure 7. Dollar Index trend.
Effect on the dollar
The area where US trade policies could end up having a lasting effect is the US currency. In the first half of 2025, the dollar lost 10% against a basket of currencies of the US’s trading partners (see Figures 7 and 8) and is heading for its sharpest annual decline since 2017, with Wall Street banks predicting further weakness in 2026 as the Federal Reserve continues to cut interest rates.
Despite a slight strengthening in the last quarter of 2025, the dollar never recovered its pre-election position. A certain decline was to be expected, given that the dollar is particularly sensitive to monetary policy and the Federal Reserve cut interest rates three times in the second half of the year. At the beginning of the year, some analysts would even have bet on the dollar strengthening as a result of the announced tax cuts. But this clearly did not happen. On the contrary, US foreign policy, and in particular tariff policy, had a lasting effect and undermined the dollar’s role in the global financial system. This year, central banks around the world reduced their holdings of Treasury securities and bought more gold, diversifying away from the dollar due to geopolitical concerns and the risk of sanctions.
The dollar could strengthen in 2026, supported by the artificial intelligence boom, a strong US economy, and a shift in expectations regarding interest rate cuts. Although the presidency has called for lower interest rates, the US central bank has so far maintained its policy independence.
All told, in 2025, the greenback lost 9.5% against a basket of major currencies, a weakening that is the combined result of the trade war and the Fed’s rate cuts since the second half of the year.
Precious metals
In summary, while precious metals enjoyed a year of grace, favored by macroeconomic factors and uncertainty, industrial metals benefited from solid physical demand linked to economic growth and investments in infrastructure and sustainability.